
Fight Intelligence · free
Any two fighters, side by side
Win probability from the Cage Nightly Fight Model, skills ranked inside each weight class, numbers adjusted for the quality of the opposition and what to expect if they met tonight.

Computed from the numbers belowWhat decides it
- 01
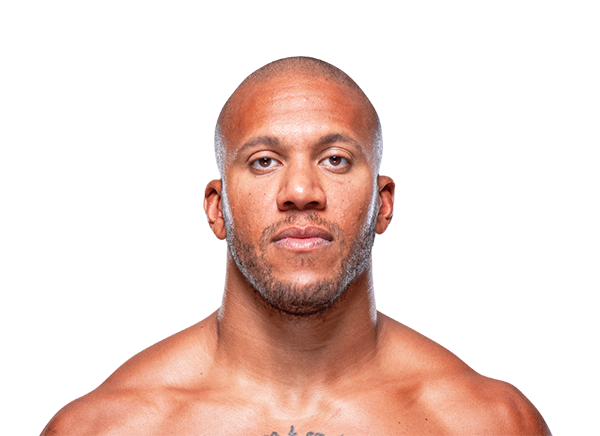
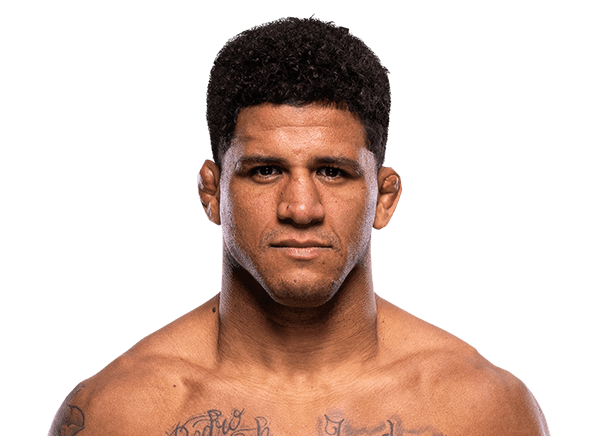
Stephen Thompson is the model's pick at 55%, with neither corner assigned.
- 02
Widest gap: wrestling. Burns ranks 85th percentile in the division, Thompson 12th.
- 03
Burns is trending down on the feet: −2.7 strikes a minute (landed minus absorbed) over the last five, against −0.5 across the career.
- 04
On the feet the numbers lean to Thompson: about 4.9 significant strikes a minute expected, against 3.2 for Burns.
Inside the probabilityWhat moves the number
↳Bottom lineThe biggest single push is takedowns vs what opponents allow, towards Burns. 5 ingredients lean to Burns and 7 to Thompson; on balance Thompson has the stronger case.
?How to read this chart
- Each bar
- is one ingredient of the Fight Model and how far it pushes the probability, on the log-odds scale. Left = it helps Burns, right = it helps Thompson.
- Neutral corner:
- the UFC usually puts the favourite in red, and the model knows it. Here the number is the average of the two possible corner assignments, so the corner favours no one.
- Ingredients overlap,
- so a bar is the push on top of everything else, not a full story on its own. How each one is measured is on the method page.
Percentiles inside each weight classSkill profile
↳Bottom lineThompson leads on 5 of the eight skills by ten points or more, Burns on 3.
?How to read this chart
- Each row
- is a percentile from 0 to 100 against the fighters of the same division with at least three UFC fights in the last three years (82 fighters at Welterweight). 50 is the middle of the pack, 90 is the top tenth.
- Higher is always better,
- defense and durability included: a high striking defense means they absorb fewer strikes than their opponents usually land.
- Adjusted for the opposition:
- landing five strikes a minute against a fighter who usually concedes two counts for more than against one who concedes six.
Opponent-adjusted, against the UFC averageIf they met tonight
↳Bottom lineThompson should out-land Burns on the feet, 4.9 to 3.2 a minute; on the mat Burns has the edge, 2.6 takedowns per 15 minutes to 0.0.
?How to read this chart
- The expected numbers
- start from the UFC average of the last five years (4.0 significant strikes a minute, 1.4 takedowns per 15 minutes), add how much more the attacker usually lands than their opponents concede, and how much more the defender usually concedes than their opponents land.
- A simple additive estimate,
- not a simulation: it does not know who will be on top, or for how long. It tells you which way each phase of the fight leans.
| Above or below what opponents usually allow | Burns | Thompson |
|---|---|---|
| Strikes landed / min | +0.1 | +0.9 |
| Strikes absorbed / min | −0.0 | −0.9 |
| Takedowns landed / 15 min | +1.1 | −1.0 |
| Takedowns conceded / 15 min | −0.8 | +0.0 |
| Control time, share of the fight | +7 pts | −12 pts |
Last five UFC fights against the whole careerForm
↳Bottom lineStriking margin over the last five against the career, strikes a minute: Burns −2.2, Thompson +0.3.
?How to read this chart
- Career
- is every UFC fight with official statistics; Last 5 is the five most recent. The arrow appears when the last five differ from the career by 15% or more (and by a meaningful amount, not 0.1 against 0.0), pointing up when that is good news for the fighter.
- Avg opponent rating
- is the Cage Nightly rating of the opponents on the night: a fighter whose numbers rise while the opposition gets tougher is improving for real.
| Career (25) | Last 5 | ||
|---|---|---|---|
| Sig. strikes landed / min | 3.2 | 2.5 | ▼ |
| Sig. strikes absorbed / min | 3.7 | 5.3 | ▼ |
| Takedowns / 15 min | 2.0 | 1.7 | • |
| Takedowns conceded / 15 min | 0.9 | 1.3 | • |
| Control time | 23% | 11% | ▼ |
| Win rate | 60% | 0% | ▼ |
| Avg opponent rating | 1551 | 1603 | • |
| Career (23) | Last 5 | ||
|---|---|---|---|
| Sig. strikes landed / min | 4.1 | 4.8 | ▲ |
| Sig. strikes absorbed / min | 2.9 | 3.3 | • |
| Takedowns / 15 min | 0.2 | 0.0 | • |
| Takedowns conceded / 15 min | 1.4 | 3.0 | ▼ |
| Control time | 6% | 3% | • |
| Win rate | 57% | 40% | ▼ |
| Avg opponent rating | 1554 | 1560 | • |