
Scorecard
A win probability is only worth something if it comes true as often as it says. Here is every UFC fight since 2011 scored against the probability the Cage Nightly Fight Model gave before the fight. Every number is out of sample: each year's model was fitted only on the fights before that year.
7,343 fights scored, all out of sample · draws and no contests left out
The honest comparisonBetter than the simple rules?
↳Bottom lineThe Fight Model scores 0.227, against 0.244 for always-red, 0.244 for the plain Elo and 0.250 for a coin flip, and picks 62.1% of winners. It beat the red-corner rule in 16 of 16 seasons and the Elo in 16 of 16.
?How to read this chart
- Four ways to put a number on a fight,
- scored on the same 7,343 fights since 2011. Each is only allowed what was known before the bell.
- The Brier score
- is the average squared gap between the probability given and what happened (1 for a win, 0 for a loss). Lower is better: a coin flip scores 0.250, a perfect oracle 0. The lower the score, the longer the bar.
- Picked right
- is how often the side given more than 50% won. It ignores how confident the number was, which is why the Brier score comes first.
- Why the red corner matters:
- the UFC usually puts the favourite or the champion in red, so “always red” is a hard rule to beat. Our old Elo-only probability did not beat it. Before 2010 our source lists every winner in red, so those years are left out of every comparison here.
The real benchmark is the betting market. We have logged market prices for 12 finished fights so far: too few to score fairly, so that comparison opens at 200.
Inside the modelWhat moves the number
↳Bottom lineThe three biggest levers: strikes absorbed vs what opponents land, red corner (the ufc's designated favourite or champion), age.
?How to read this chart
- One row per ingredient,
- ordered by how much it moves the probability. Each bar is the effect of a typical difference between two fighters (one standard deviation), on the log-odds scale the model works in.
- Gold pushes towards
- the fighter who has more of it, grey against: an older fighter, or one who absorbs more strikes than opponents usually land, is less likely to win.
- Opponent-adjusted
- means each fight is measured against what that opponent usually allows or lands, so 60 strikes against a great defender count for more than 60 against a poor one.
The full method: every ingredient, how the opponent adjustment works and how the out-of-sample test is run.
Does 70% mean 70%?
↳Bottom lineOn average the model is 1.9 points off what happened; the widest miss is the 75–80% group (said 77%, won 73%, 539 fights).
?How to read this chart
- Each dot
- is a group of fights where the favourite had a similar pre-fight chance. Across = what the model said; up = how often the favourite really won. Bigger dot = more fights.
- The gold diagonal
- is a perfectly honest number. Above it, favourites won more than we said; below it, less. The short stem shows the size of the miss.
- 50–55%said 53% · won 49%1,481 fights
- 55–60%said 57% · won 58%1,569 fights
- 60–65%said 62% · won 60%1,319 fights
- 65–70%said 67% · won 67%1,156 fights
- 70–75%said 72% · won 71%834 fights
- 75–80%said 77% · won 73%539 fights
- 80–85%said 82% · won 80%319 fights
- 85–90%said 88% · won 85%124 fights
Year by yearEvery season, out of sample
↳Bottom lineThe model had the lowest score in 16 of 16 seasons; its best year was 2025 (0.215).
?How to read this chart
- Three lines, one per method,
- left (oldest) to right. Each point is that season's Brier score. Lower is better, so the best line runs along the bottom.
- Gold = the Fight Model,
- grey = the plain Elo rating, red = always picking the red corner. The dashed line is a coin flip (0.250).
- Each year is fresh:
- the model used for 2015 had never seen a 2015 fight.
Where the model is sharp, where it is notBy situation
The bigger the rating gap, the safer the favourite
↳Bottom lineWhen the gap is under 50 points the favourite wins 61% (5,239 fights); at 150+ points, 76% (50 fights, a small sample).
?How to read this chart
- Each column
- groups fights by how far apart the two fighters were on the rating before the bell, in points (left = close, right = a big gap).
- Height and %
- = how often the higher-rated fighter won; the small number is the fight count.
Division by divisionMost and least predictable weight classes
↳Bottom lineCatchweight is the easiest to read (67.1% of 76 fights), women's bantamweight the hardest (59.6% of 255). With samples this size, a few points either way is noise.
?How to read this chart
- One row per weight class
- ordered from most to least predictable. The bar and % = how often the model's favourite won there; the small number is the fight count.
How it endsUpsets come by knockout
↳Bottom lineUnderdogs win by KO/TKO 34% of the time, favourites 32%.
?How to read this chart
- Two bars
- split every fight won by the model's favourite, and every fight won by the underdog, by how it ended: KO/TKO, submission or decision.
The ones we got most wrongBiggest upsets since 2011
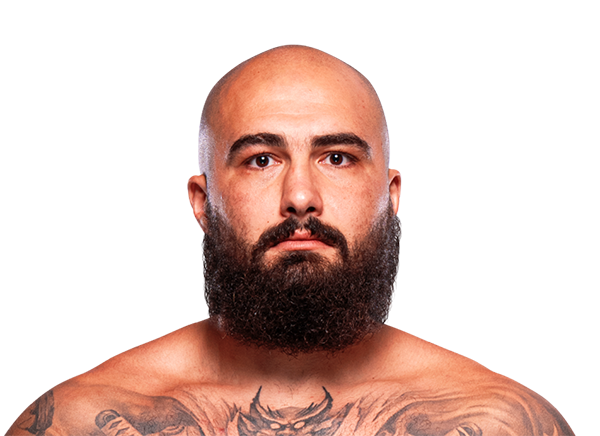
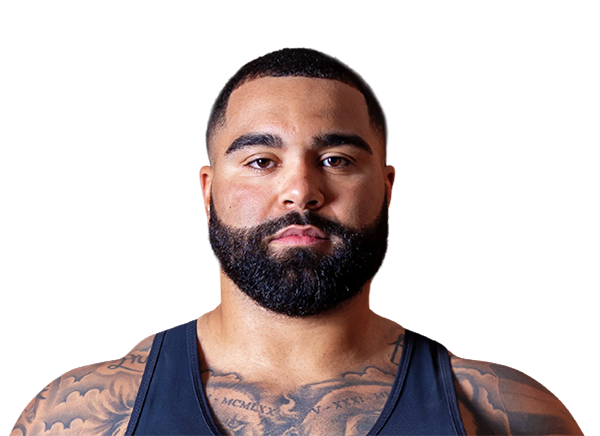 Sharaf def. StevesonUFC 331 · Sep 19, 2026 · KO/TKO R16%chance we gave the winner03
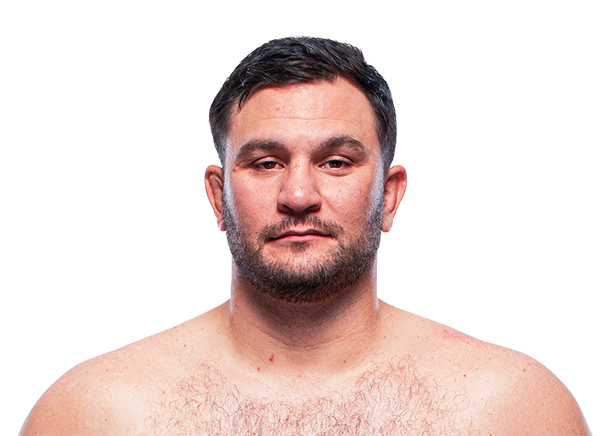 CAVillante def. AndersonUFC on FOX · Apr 18, 2015 · KO/TKO R37%chance we gave the winner04FW
 Werdum def. VelasquezUFC 188 · Jun 13, 2015 · SUB R3 · title9%chance we gave the winner05

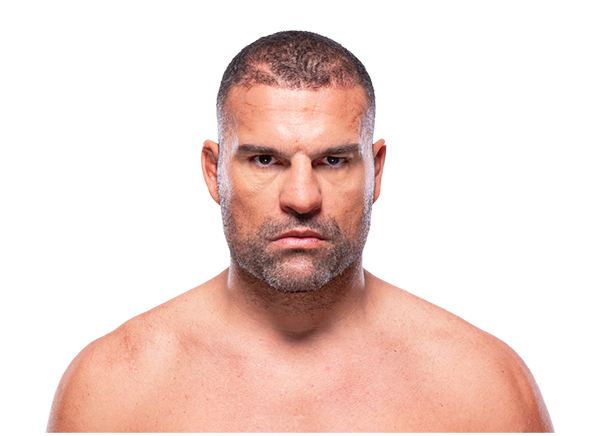 Henderson def. RuaUFC 139 · Nov 19, 2011 · DEC (U) R59%chance we gave the winner06

 Lansberg def. ChiassonUFC Fight Night · Sep 28, 2019 · DEC (U) R310%chance we gave the winner07RCHYCoulter def. YaozongUFC Fight Night · Nov 24, 2018 · DEC (U) R311%chance we gave the winner08JHCDHamman def. DollawayUFC Live · Aug 14, 2011 · KO/TKO R211%chance we gave the winner09

 Lewis def. BlaydesUFC Fight Night · Feb 20, 2021 · KO/TKO R212%chance we gave the winner10

 Le def. FranklinUFC Macao · Nov 10, 2012 · KO/TKO R112%chance we gave the winner11JVJSVazquez def. StevensonUFC Live · Jun 26, 2011 · DEC (U) R313%chance we gave the winner12
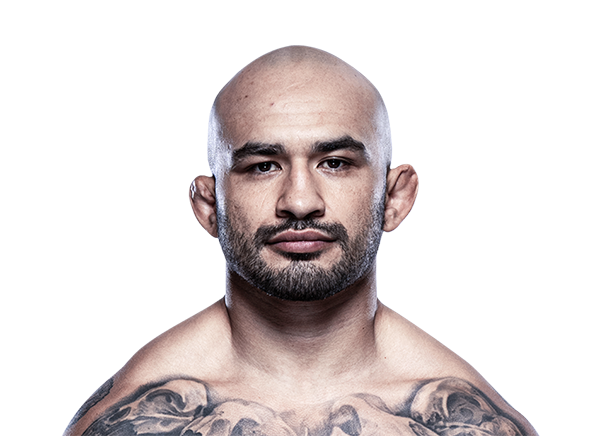
 Gurule def. HasanUFC 334 · Nov 14, 2026 · DEC (S) R313%chance we gave the winner
12 frozen picks settled
The test above is out of sample year by year, but the list of ingredients was chosen in November 2026 by people who know how MMA history went, so it may still flatter us a little. The real test is the ledger: every probability is logged before the fight, frozen at the first bell and scored here as results come in. So far 58.3% of favourites have won.