
The Odd Numbers
The stats nobody else publishes. Where the knockouts happen, what thin air does to a fight, which referees let it go, which judges dissent and how often the fighter who landed less still got the decision.
Knockout capitals
Every host city with at least 60 UFC fights, ranked by how often the fight ends with a knockout. Same promotion, same rules, very different nights.
↳Bottom lineAtlantic City tops the list: 45.2% of its 93 fights end in a knockout, against 24.1% in Nashville.
?How to read this chart
- One row per city
- ranked by knockout rate. The bar is all the UFC fights held there, split by how they ended: KO/TKO (knockout, or the referee stopping it for strikes), submission (a tap-out) and decision (the judges).
- The small print
- gives the number of fights and the average fight length in minutes.
Thin air
Fights above 1,200 metres against everywhere else since 2001. The pace change compares significant strike attempts in round 3 with round 1 in fights that went the distance: a plus sign means fighters threw more in the third round, not less.
- KO rate
- 25%
- Avg fight
- 10.7 min
- Went the distance
- 52.1%
- Pace change R1→R3
- +22.4%
- KO rate
- 41%
- Avg fight
- 10.8 min
- Went the distance
- 44.3%
- Pace change R1→R3
- +16.2%
- KO rate
- 35.7%
- Avg fight
- 9.9 min
- Went the distance
- 37.5%
- Pace change R1→R3
- +1.8%
- KO rate
- 32.8%
- Avg fight
- 10.7 min
- Went the distance
- 47.2%
- Pace change R1→R3
- +12.3%
The home myth
Every fight between a fighter from the host country and a fighter from abroad, then the same fights checked against what the Fight Model expected from each fighter's record, rating and corner.
No edge we can measure
What this does not prove. It does not show the crowd has no effect. Home fighters are in the red corner 65% of the time, and the model already credits the red corner, so part of any home boost could hide there. A sample this size also cannot rule out an edge of a couple of points.
↳Bottom lineHome fighters won 50.9% since 2011, against 50.8% expected from their records: +0.1 points, within ±2.1.
?How to read this chart
- The ring
- is the share of these fights won by the fighter from the host country, all years. 50% would be an even split, but it is not the right yardstick on its own: the home fighter may simply be the better fighter more often.
- The check
- uses only fights since 2011 and compares wins with the Fight Model's pre-fight expectation, computed out of sample. The margin of error is the 95% range for a sample this size.
- The chips
- are the same number for each host country, with the fight count beneath. Highlighted = 55% or more; dimmed = 45% or less. Small counts swing easily.
The KO clock
Every knockout and submission in UFC history, placed on the fight clock: which half-minute of the round it came in. Pick a round to see how the danger moves.
↳Bottom line11% of knockouts land between 1:00 and 1:30 of a round, level with 4:30–5:00. 28% in the first 90 seconds · 21% in the last minute · 3% waved off at the bell.
?How to read this chart
- Each bar
- is 30 seconds of a five-minute round, from the opening bell on the left to 5:00 on the right. Taller bar = more knockouts in that half-minute; the number on top is the count.
- Bell
- (the separate column) = fights waved off at exactly 5:00, between rounds, by the doctor or the corner.
- The buttons
- switch between knockouts (including referee stoppages for strikes) and submissions, and between all rounds or a single round.
Referees and finishes
Referees with at least 250 UFC fights: how many of their fights ended inside the distance, next to the other referees working the same nights, and the average clock time of their first-round knockouts.
↳Bottom lineJohn McCarthy has the highest finish rate here, 65.2%; the widest gap with the other referees on the same nights belongs to John McCarthy, +9.2 points (65.2% against 56%).
?How to read this chart
- The gauge
- is the share of that referee's fights that ended inside the distance (KO, TKO or submission) instead of going to the judges.
- Same nights
- is the finish rate of every other referee on the cards that referee worked: same era, same venue, same kind of event. It is the fair comparison for the gauge.
- R1 KO at
- is the average clock time of their first-round knockouts. It depends on the fights as much as on the referee.
- Not a verdict on the referee.
- Referees do not pick their bouts, and the commission may hand some of them the heavier hitters. A gap shows where finishes happened, not that anyone stopped a fight early or late.
The dissenters
In every split decision one judge sees it the other way, so the average dissent rate is 33%. These are the judges with at least 300 UFC cards and how often they were the odd one out.
↳Bottom lineChris Lee is the odd one out in 35.9% of 145 split decisions.
?How to read this chart
- One bar per judge
- = how often, in the split decisions they scored, they were the one judge who saw it the other way.
- The dashed line
- is 33%, what you would expect if dissent were spread evenly across the three judges. Past the line = dissents more than chance.
Robbed by the numbers
861 of 4,102 UFC decisions went to the fighter who landed fewer significant strikes. These are the widest gaps where the winner had no real grappling case either (two takedowns or fewer, under three minutes of control).
- 1

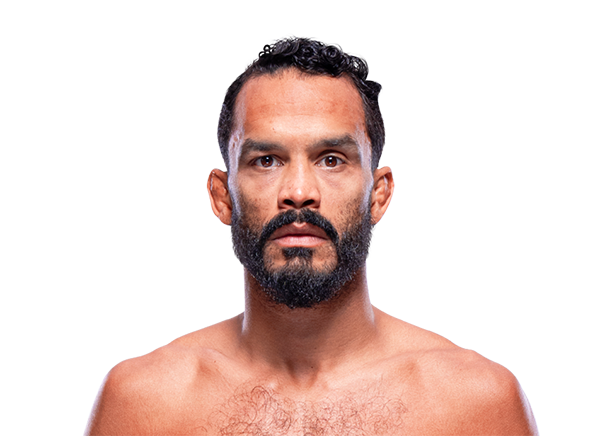 Marlon Vera def. Rob FontUFC Fight Night · 2022 · Unanimous decision159 – 271sig. strikes−112
- 2
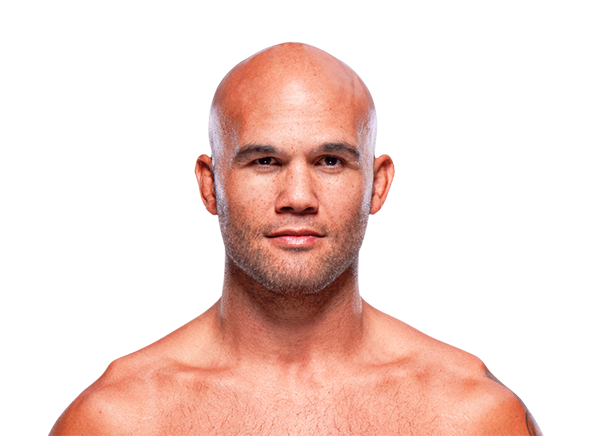
 Robbie Lawler def. Carlos ConditUFC 195 · 2016 · Split decision92 – 176sig. strikes−84
- 3

 Priscila Cachoeira def. Ji Yeon KimUFC Fight Night · 2022 · Unanimous decision102 – 170sig. strikes−68
- 4

 Irene Aldana def. Karol RosaUFC 296 · 2023 · Unanimous decision145 – 204sig. strikes−59
- 5
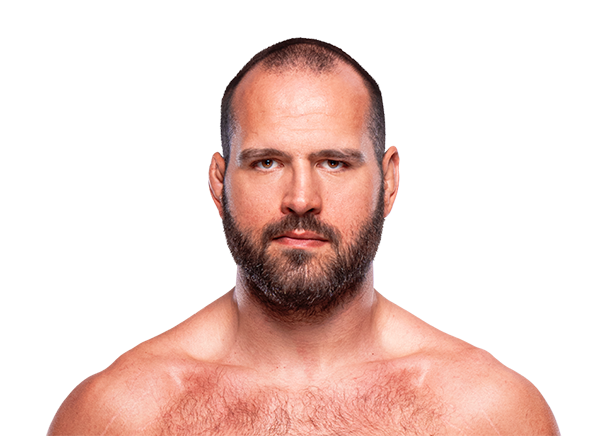
 Martin Buday def. Lukasz BrzeskiUFC Fight Night · 2022 · Split decision66 – 118sig. strikes−52
- 6
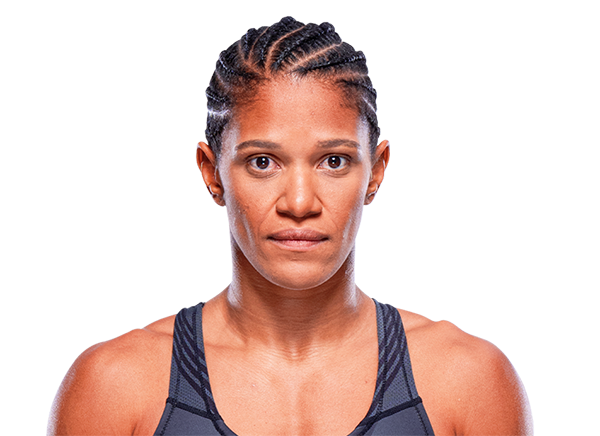
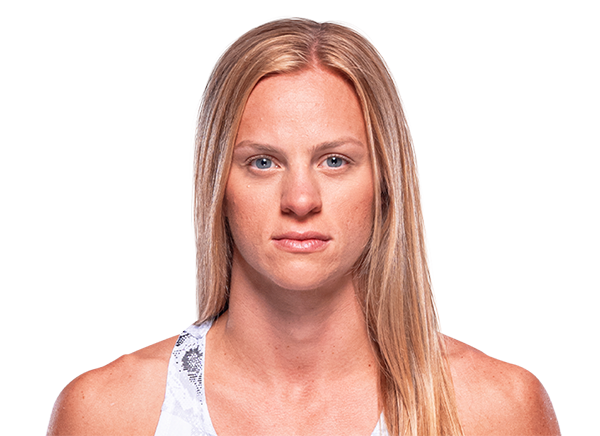 Gabriella Fernandes def. Carli JudiceUFC Fight Night · 2024 · Split decision119 – 169sig. strikes−50
- 7LM
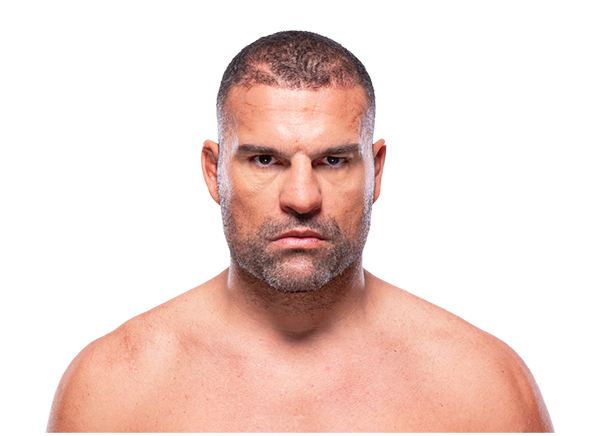 Lyoto Machida def. Mauricio RuaUFC 104 · 2009 · Unanimous decision35 – 80sig. strikes−45
- 8
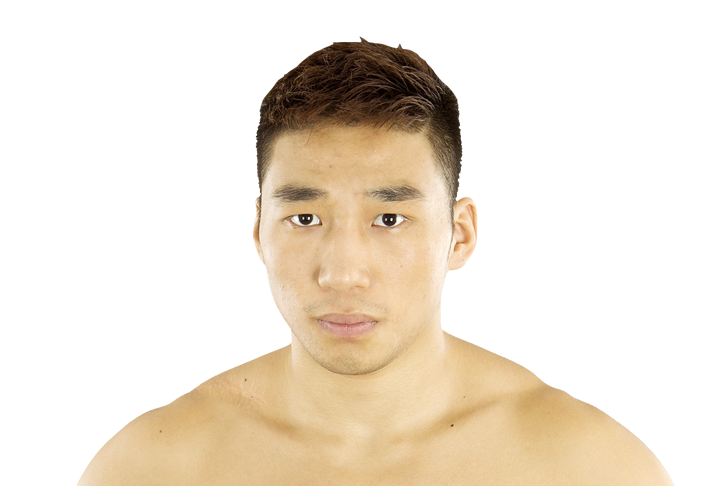
 Yao Zhikui def. Nolan TicmanUFC Fight Night · 2015 · Split decision9 – 52sig. strikes−43
- 9

 Thiago Moises def. King GreenUFC Fight Night · 2020 · Unanimous decision42 – 85sig. strikes−43
- 10SM
 Sergio Moraes def. Tim MeansUFC Fight Night · 2018 · Split decision87 – 129sig. strikes−42
Significant strikes are not the only way judges score a round: damage, takedowns and control count too. This list is where the stat sheet and the cards disagree the most.
Dropped, still won
Fights won by the fighter who was knocked down at least once. Below, the wins after two knockdowns or more.
The great escapes won after two knockdowns or more
 3× downAlejandro Perezbeat Andre SoukhamthathSplit decisionUFC Fight Night · 2017
 2× downJoel Faglierbeat Javad MahjoubKO/TKO · R2UFC Fight Night · 2026
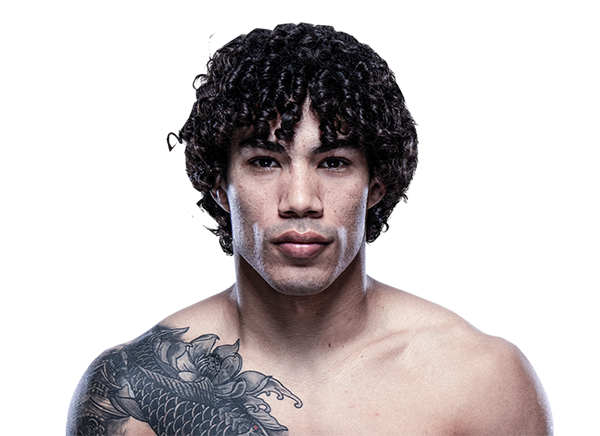 2× downImanol Rodriguezbeat Kevin BorjasKO/TKO · R2UFC Fight Night · 2026
 2× downJared Cannonierbeat Gregory RodriguesKO/TKO · R4UFC Fight Night · 2025
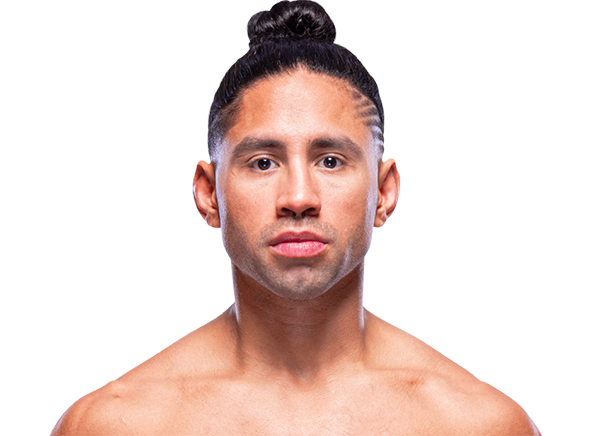 2× downCJ Vergarabeat Daniel LacerdaKO/TKO · R2UFC Fight Night · 2023
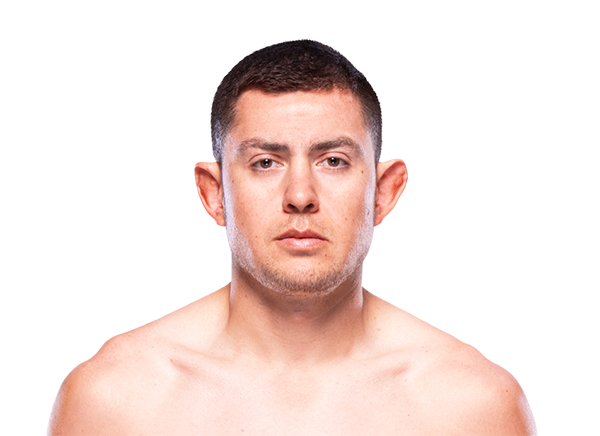 2× downSteve Garciabeat Charlie OntiverosKO/TKO · R2UFC Fight Night · 2021
 2× downJohnny Walkerbeat Ryan SpannKO/TKO · R1UFC Fight Night · 2020
 2× downEd Hermanbeat Mike RodriguezSubmission · R3UFC Fight Night · 2020
The eras
How UFC fights have ended, year by year. The sport learned to defend itself: watch the decision line climb.
↳Bottom lineIn 1994, 0% of fights went to the judges; in 2026 it was 42.6%.
?How to read this chart
- Three lines, one per ending
- left to right is the year; up is the share of that year's UFC fights that ended that way.
- Early years
- had few events, so the lines jump around more on the left.
Rounds 4 and 5
How title fights and main events actually end, round by round, over 25 minutes.
↳Bottom line18.2% of five-round finishes came in round 4 or 5; 38.7% went the distance.
?How to read this chart
- One column per round
- of scheduled five-round fights (title fights and main events): the share of all of them that ended in that round. Fire = knockout, violet = submission.
- The gold column
- is the fights that went all 25 minutes to the judges. Rounds 4 and 5, the championship rounds, only exist in these fights.
All numbers from Cage Nightly's fight archive: every UFC fight since 1994 with round-by-round stats. Updated every six hours. Methodology · Records · Predictions on the record