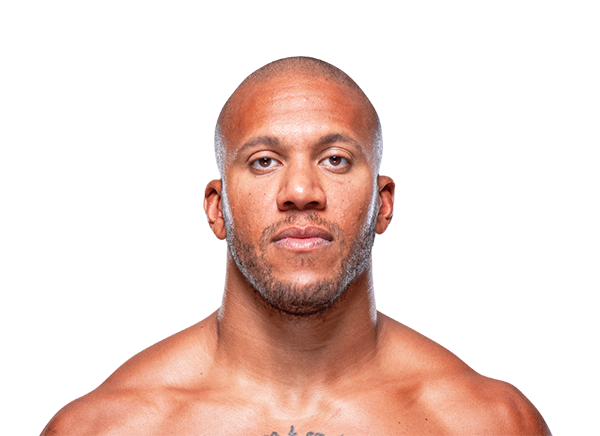

Brian Foster
def. Brock Larson
Punches to Head On Ground Submission to Strikes; Two Points Deducted: Illegal Strike to Grounded Opponent by Larson
Who owned each round
↳Bottom lineOn the numbers: Foster 2 rounds, Larson 0. This is a stats score, not the judges' cards.
?How to read this chart
- One bar = one round
- scored from the official numbers: significant strikes (the strikes that count), knockdowns (worth six strikes), takedowns (worth two), submission attempts and control time.
- Up or down
- a bar above the line is a round Foster (red) won on the numbers, below the line a round for Larson (blue). Taller = more one-sided. The pair of numbers is significant strikes landed, red–blue; ✕ KD marks a knockdown.
- The gold line
- is the running total: where it ends, above or below the middle, shows who was ahead on the numbers overall.
It ended in round 2. Foster landed 16 significant strikes to Larson's 1, 1 takedown and 0:36 of control in that round.
↳Bottom lineBrian Foster out-landed Brock Larson 28 to 6 on significant strikes and Foster had more control time (2:57).
?How to read this chart
- Each line
- is one stat for the whole fight: the red corner's number on the left, the blue corner's on the right, and the bar split by their share of the two.
- Small print
- under strikes and takedowns is landed of attempted. Significant strikes are the power shots and anything thrown at distance, not light taps; control time is how long one fighter held the other down or against the fence.
Fight totals
Where the strikes landed
Where the strikes landed
↳Bottom lineFoster aimed 79% of landed strikes at the head, Larson 83%.
?How to read this chart
- One figure per fighter
- showing every significant strike they landed (power shots and anything thrown at distance, not light taps). The brighter a zone, the bigger its share of the total.
- The labels
- give the share and landed/thrown for head, body and legs: 12/30 means 12 landed out of 30 thrown.
- The three bars
- split the same strikes by position: at distance, in the clinch (tied up standing) or on the ground.
Every roundRound stats
| Round | Fighter | Sig. str. | Total | KD | TD | Sub att. | Control | Head | Body | Legs |
|---|---|---|---|---|---|---|---|---|---|---|
| R1 | Brian Foster | 12/32 | 25/46 | 0 | 1/3 | 0 | 2:21 | 9 | 2 | 1 |
| Brock Larson | 5/9 | 18/22 | 0 | 1/1 | 1 | 0:54 | 5 | 0 | 0 | |
| R2 | Brian Foster | 16/31 | 32/47 | 0 | 1/1 | 0 | 0:36 | 13 | 1 | 2 |
| Brock Larson | 1/5 | 5/9 | 0 | 0/2 | 0 | 0:05 | 0 | 1 | 0 |
How they arrivedThe last five, and who they beat
 Mike PierceUFC Fight Night · Sep 2009DEC1450W
 Mike PyleUFC 98 · May 2009SUBR11450WJSJesse SandersUFC Fight Night · Apr 2009SUBR11450WKNKeita NakamuraUFC Fight Night · Dec 2006DEC1450LJFJon FitchUFC Fight Night 2 · Oct 2005DEC1450
↳Bottom lineLarson has faced the tougher opposition lately: average opponent 1450 against 1429.
?How to read this chart
- Each row
- is one recent UFC fight, newest first: W win, L loss, D draw, NC no contest; then the opponent, how it ended (KO/TKO, SUB = submission, DEC = decision) and the round.
- The number on the right
- is the opponent's Cage Nightly rating going into that fight. 1500 is an average UFC fighter, 1560+ is near the top: the higher it is, the harder the win.
- The bottom line
- sums it up: average opponent rating, wins over 1560+ opponents, and how many wins came by finish.
Who they were coming inFoster vs. Larson
Career rates use UFC fights only, including this one. Data: UFC Stats.
Referee: Yves Lavigne
After this fightWhat came next
No fight booked yet.
Ready-made cards, built from our numbers
A story for Instagram and TikTok, a square for X, Threads and WhatsApp. They update with the result.